AI economics / measurement
How exposed is an industry to AI?
From occupations and wages to comparable industry measures.
“AI exposed” is not a primitive: exposed through which jobs, weighted by what, and mapped to which industry definition?
This project treats exposure as a measurement problem. It combines Felten, Raj, and Seamans exposure scores with BLS employment and wage data, then maps NAICS industries into Fama-French portfolios through an auditable SIC crosswalk.
The output is a reusable index for later work on employment, prices, investment, and markets. It is not evidence that AI has already caused those outcomes.
01 / Construction
Occupation to portfolio
- 01
Start with occupation- and industry-level AI exposure from Felten, Raj, and Seamans.
- 02
Merge BLS employment and mean wages by occupation-industry cell.
- 03
Build equal- and wage-bill-weighted exposure inside each NAICS industry.
- 04
Crosswalk NAICS to SIC and Fama-French 49; compare equal and BEA value-added weights.
02 / Measure
Economic weight inside the workforce
The bottom-up measure gives more influence to exposed occupations that account for more of an industry's wage bill.
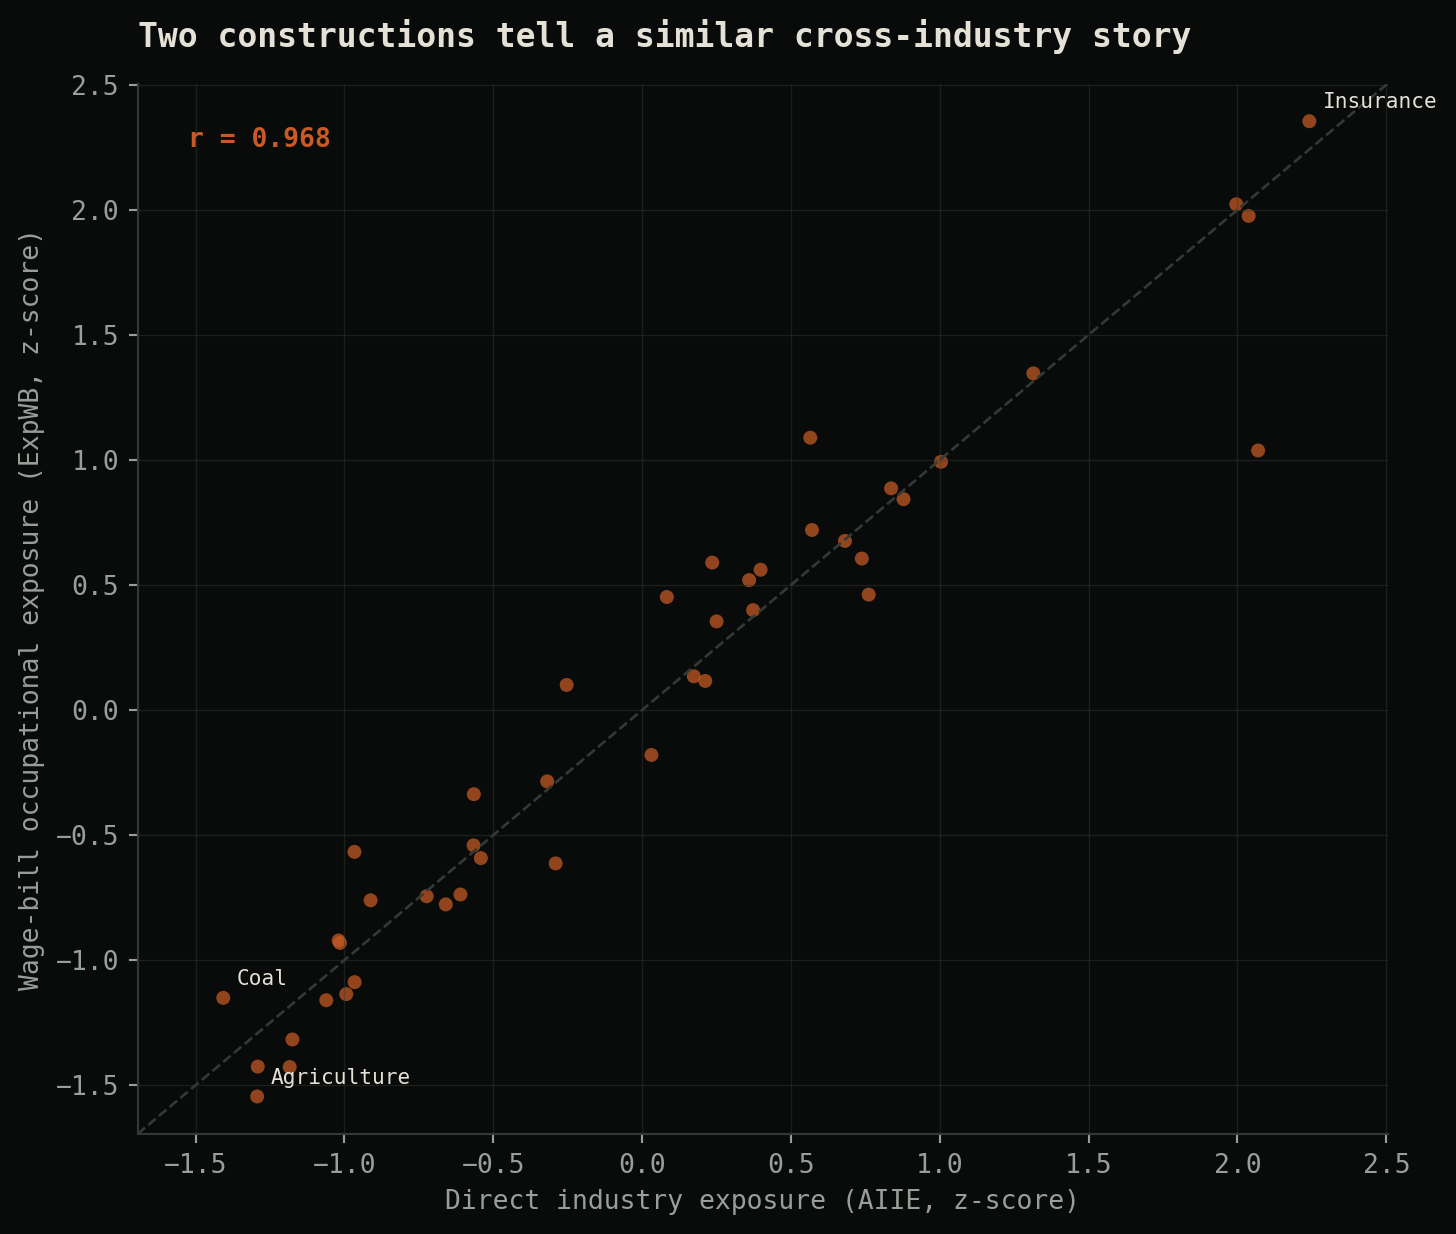
I keep a direct industry score, AIIE, alongside ExpWB. Agreement between them is informative because they reach the industry from different directions.
03 / Aggregation
NAICS industries into FF49 portfolios
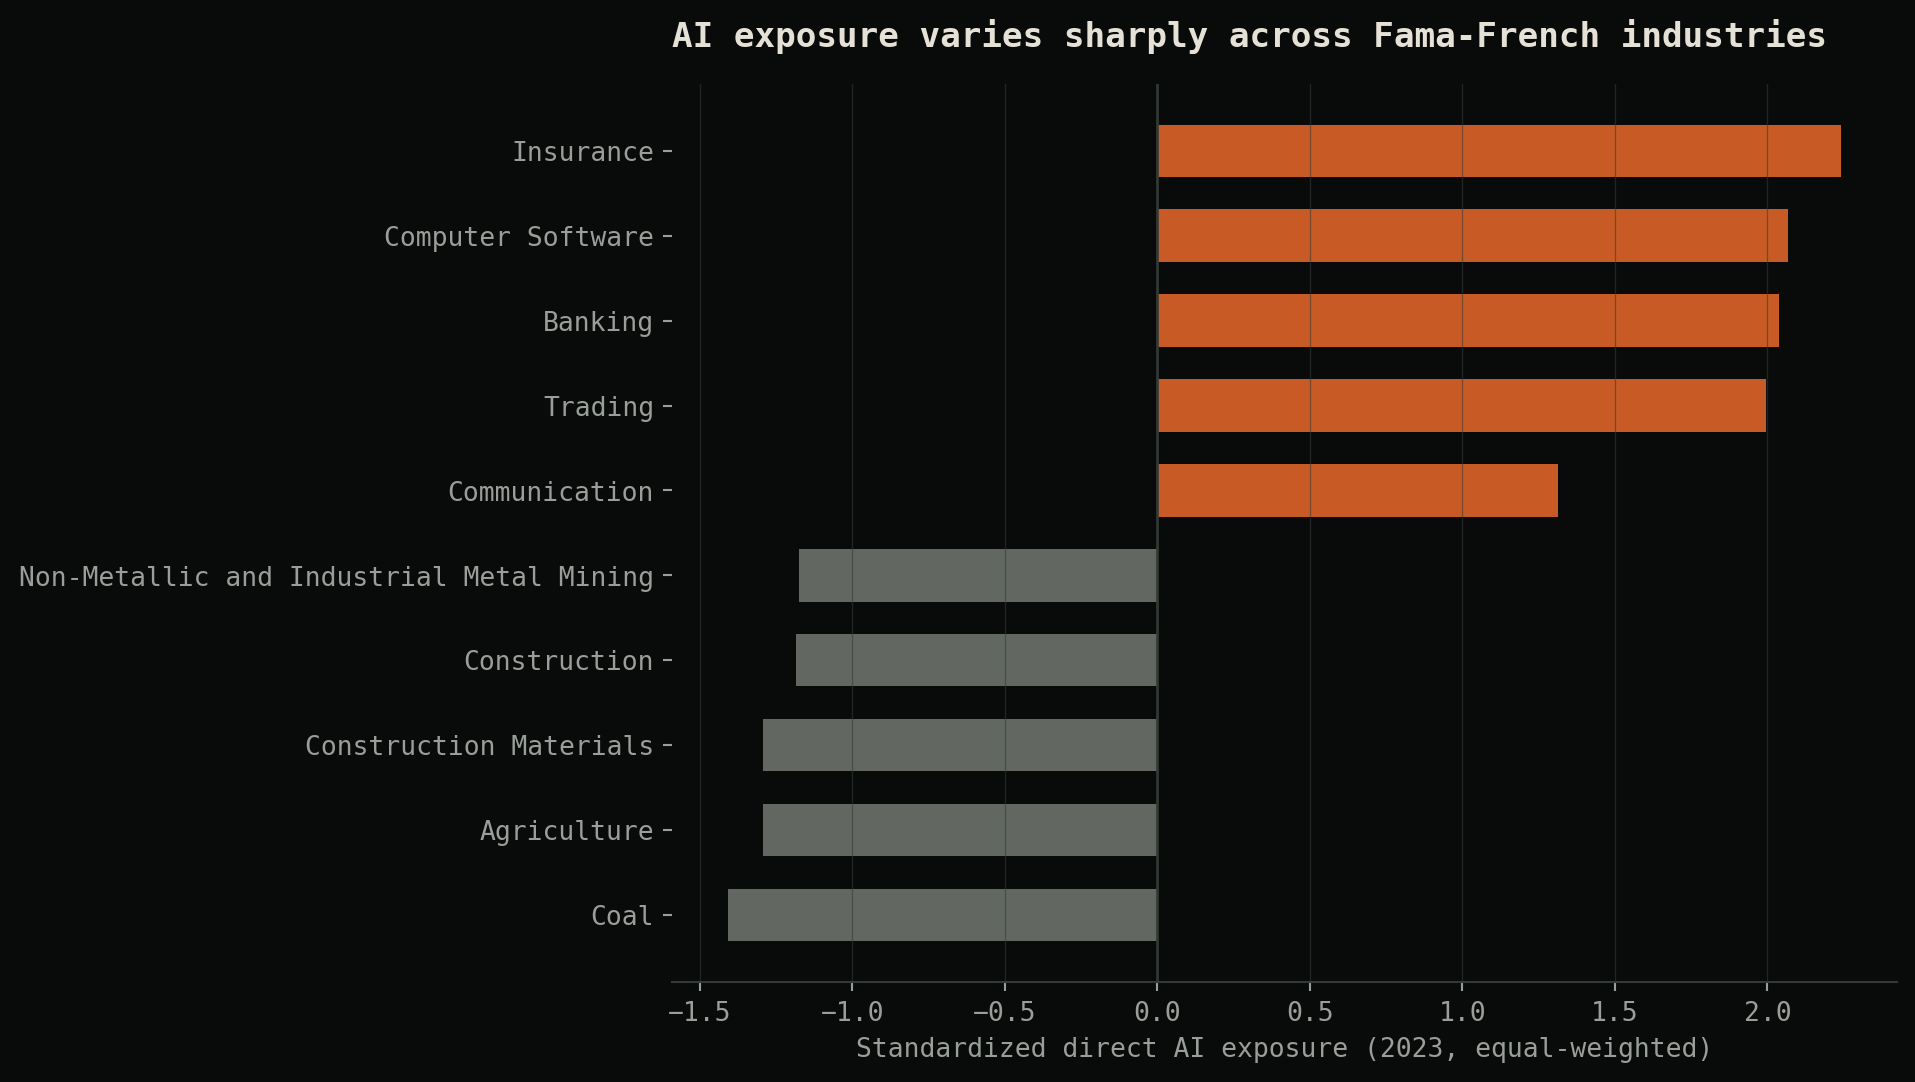
Each NAICS-4 industry is assigned to the modal Fama-French portfolio implied by its SIC crosswalk. Portfolio exposure is then calculated two ways: an equal-weighted mean and a BEA value-added-weighted mean.
Every published variant records the source vintage, aggregation rule, and whether standardization was applied. Six FF49 portfolios are excluded because the available SIC-NAICS mapping produces no valid NAICS-4 match.
04 / Use and limits
An input, not an outcome
The index can be merged into labour, investment, price, or market panels without rebuilding the classification work each time. Both equal-weighted and BEA value-added-weighted versions are published, together with mapping audits.
Exposure is not adoption, productivity, substitution, or causality. Six Fama-French portfolios do not pass current coverage checks, and crosswalk choices can matter at the edges. The public tables keep those limits visible.
05 / Tools
Tools and sources
The repository contains construction code, mapping audits, and aggregate exposure measures. Source licenses and API credentials remain outside the release.