Econometrics / prediction markets
How do inflation expectations react to CPI announcements?
Evidence from minute-level Kalshi markets.
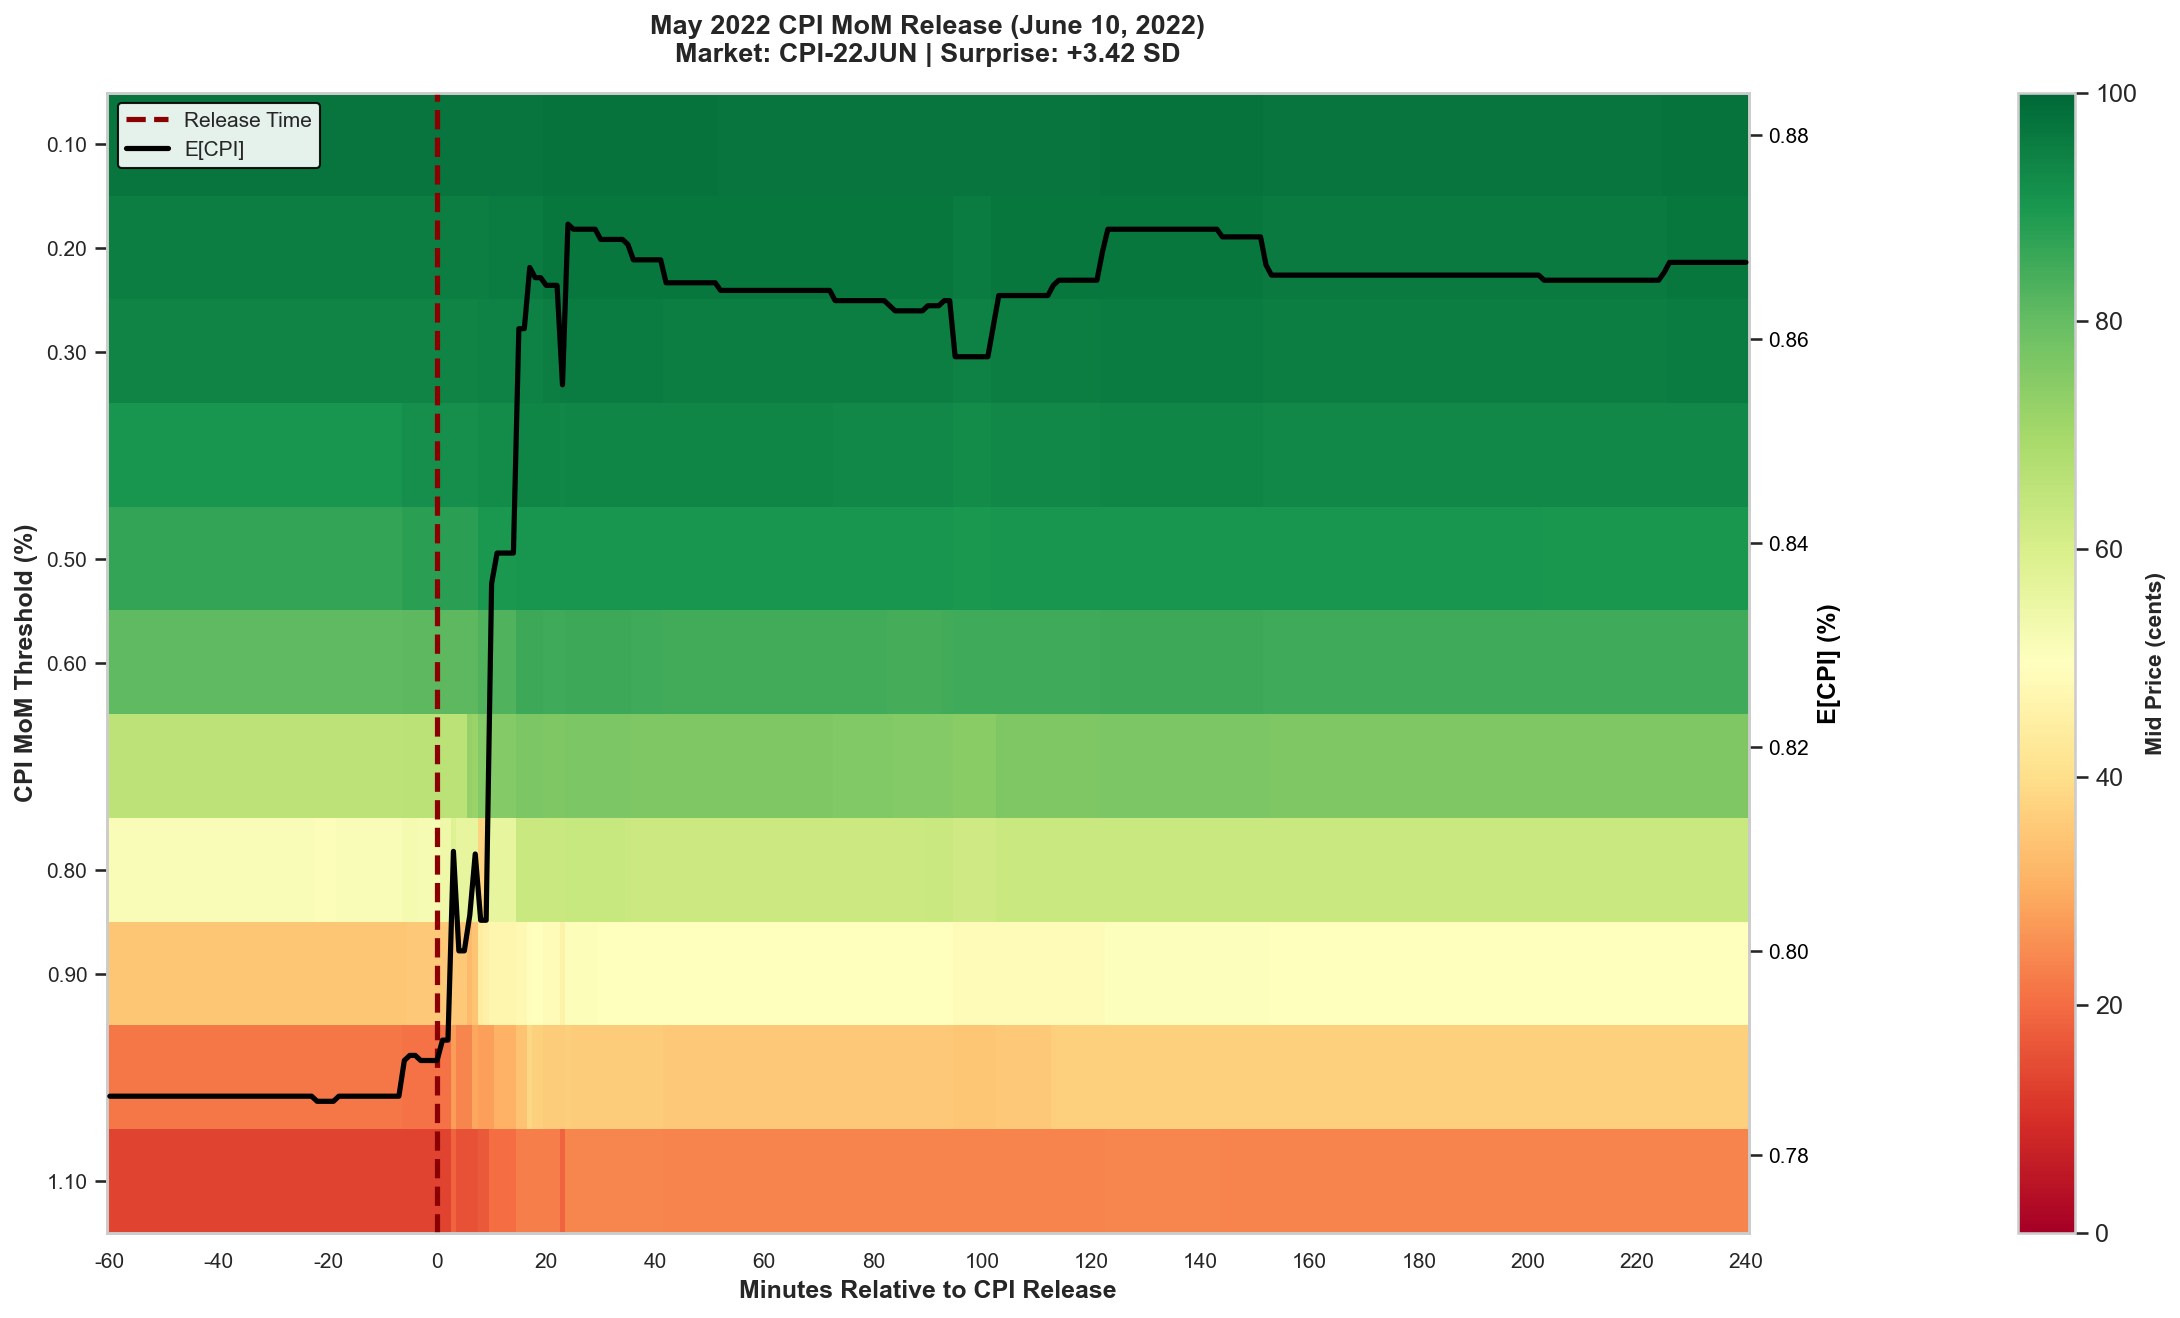
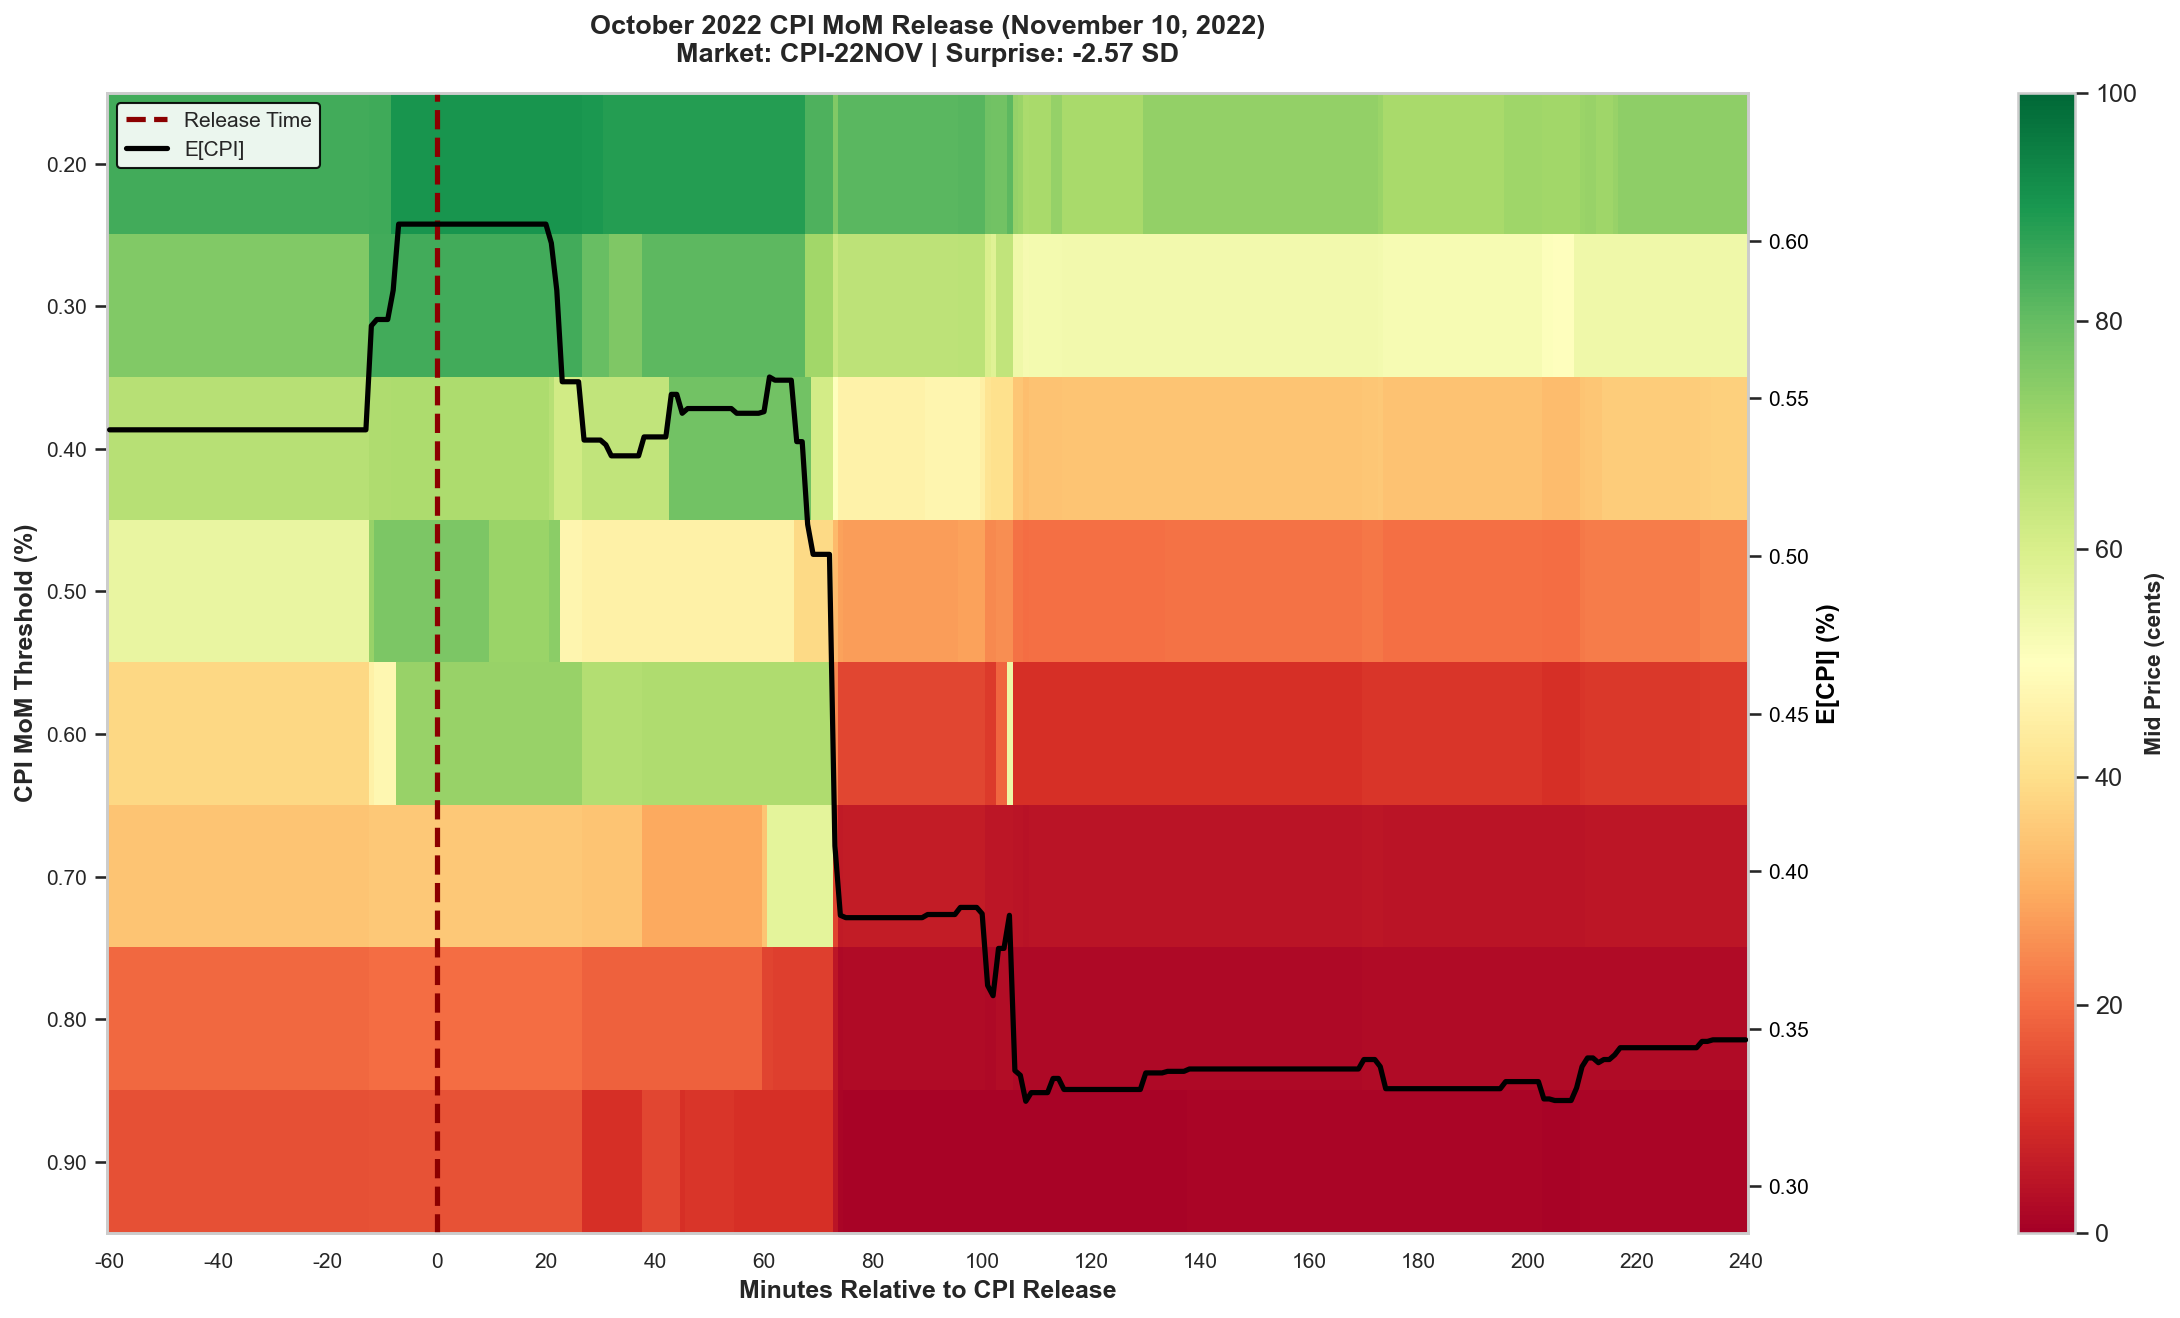
Can prediction-market prices show not only where inflation beliefs move after a CPI surprise, but how quickly they get there?
Kalshi threshold-contract prices imply a distribution over CPI outcomes. I recover its mean and variance each minute around scheduled releases. The mean response is weak for 15 minutes, significant at 30, and largest after two hours; variance does not move clearly.
01 / Research design
Announcement surprises and belief revisions
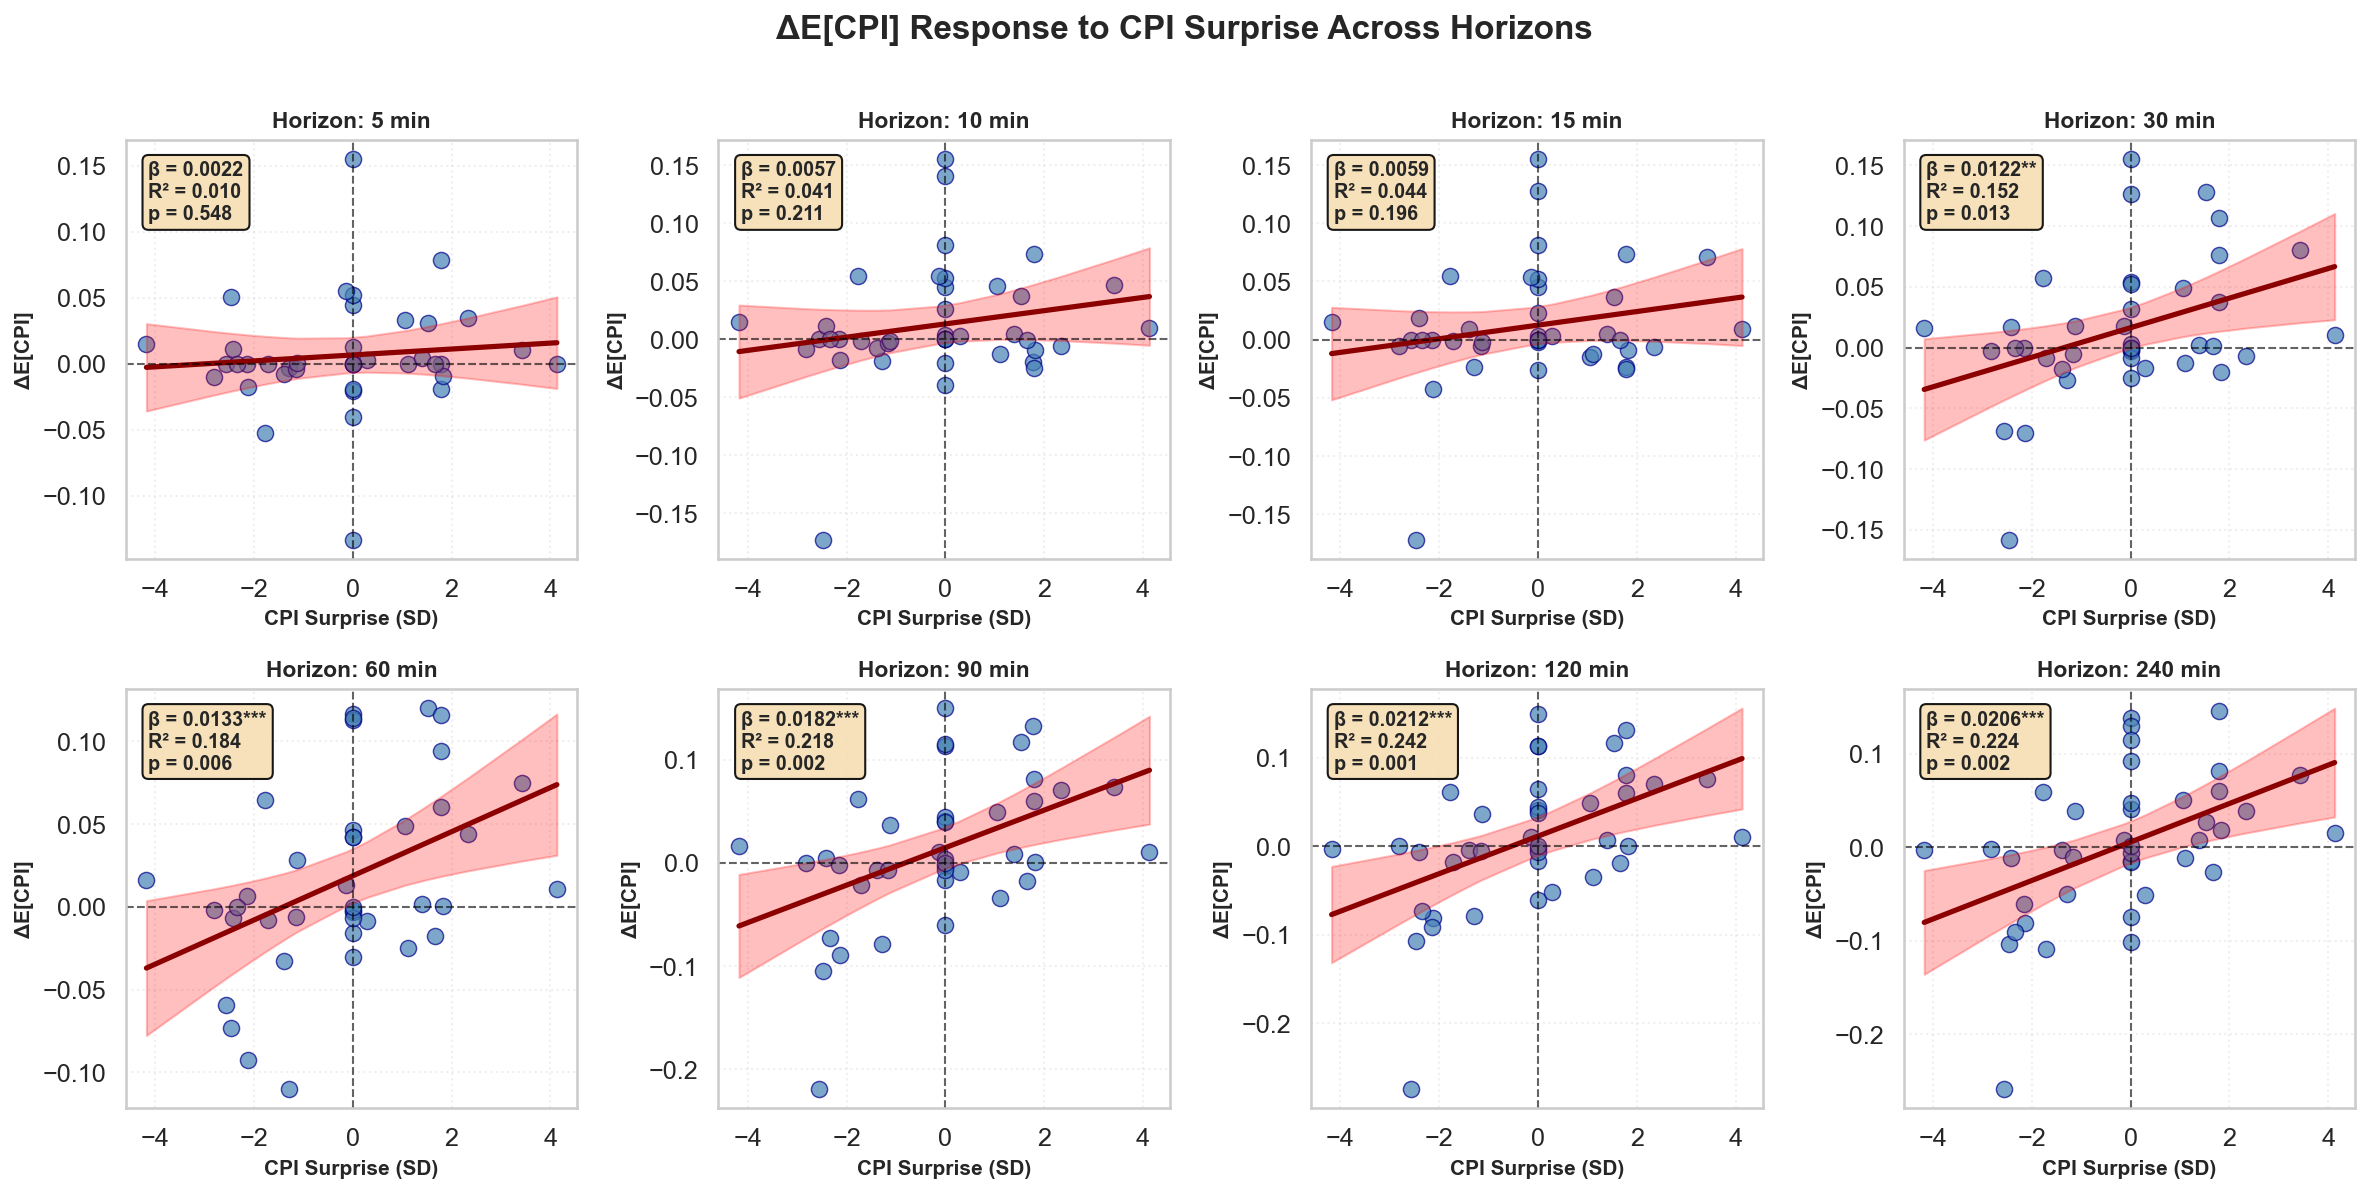
For release i and horizon h, the outcome is the change in the market-implied mean of CPI from five minutes before the announcement to h minutes after it. The surprise measure is standardized across releases.
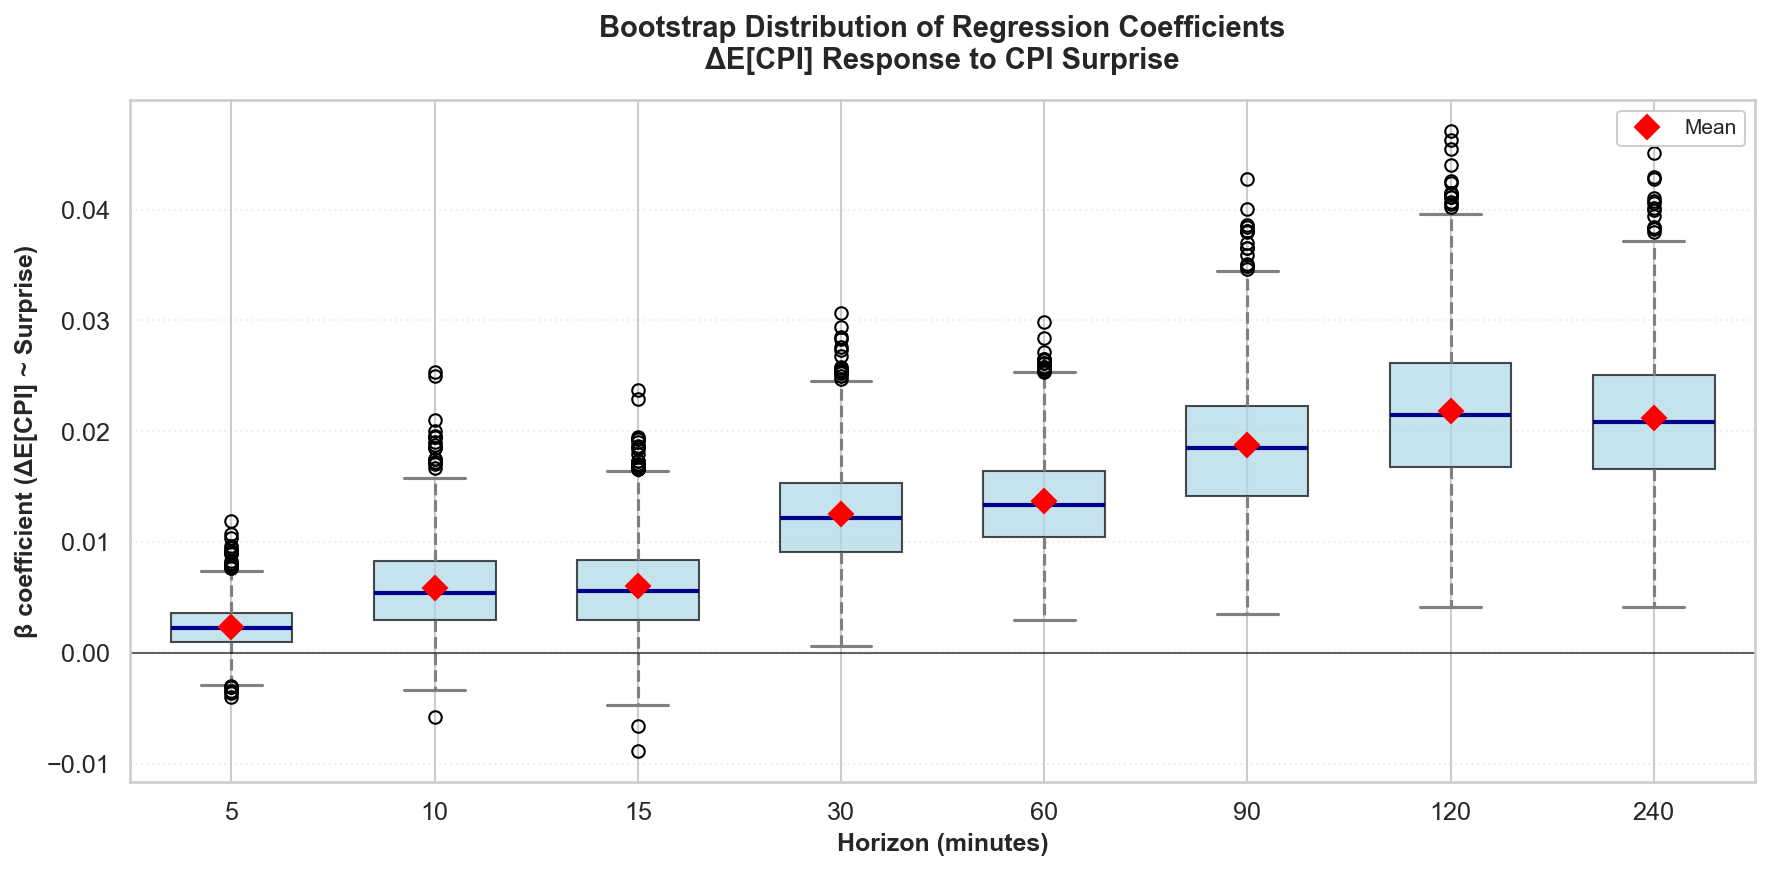
Each horizon is estimated separately by OLS with conventional standard errors. Event-block bootstrap distributions provide a small-sample stability check.
02 / Construction
From brackets to a distribution
- 01
Map each scheduled CPI release to its Kalshi threshold market.
- 02
Use adjacent threshold prices to recover probability mass across CPI outcome bins.
- 03
Calculate the implied mean and variance at one-minute frequency.
- 04
Keep events with a valid five-minute pre-release baseline and observations at every post-release horizon.
03 / Results
Adjustment takes time
The response is small and imprecise at 5, 10, and 15 minutes. At 30 minutes, the coefficient rises to 0.0122 (p = 0.013). It reaches 0.0212 at 120 minutes (p = 0.001) and remains similar at 240 minutes.
In the units used here, a one-standard-deviation CPI surprise is associated with a 0.021 percentage-point revision in implied monthly CPI after two hours. The estimated variance response remains statistically insignificant at every horizon.
04 / Estimates
Mean response by horizon
| Minutes | Beta | SE | p-value | R² |
|---|---|---|---|---|
| 5 | 0.0022 | 0.0037 | 0.548 | 0.010 |
| 10 | 0.0057 | 0.0045 | 0.211 | 0.041 |
| 15 | 0.0059 | 0.0045 | 0.196 | 0.044 |
| 30 | 0.0122 | 0.0047 | 0.013 | 0.152 |
| 60 | 0.0133 | 0.0046 | 0.006 | 0.184 |
| 90 | 0.0182 | 0.0056 | 0.002 | 0.218 |
| 120 | 0.0212 | 0.0061 | 0.001 | 0.242 |
| 240 | 0.0206 | 0.0062 | 0.002 | 0.224 |
Outcome: change in the Kalshi-implied mean of CPI MoM from five minutes before release. Regressor: standardized CPI surprise. N = 40 at every horizon.
05 / Tools
Tools and sources
06 / Implications
Hedging and a possible trading window
The estimates suggest that CPI information may take around 30 minutes to become clearly visible in the market-implied mean. If that pattern survives in larger samples and deeper markets, an inflation-linked desk could use the post-release distribution to monitor surprise risk and adjust hedges through inflation swaps or related instruments while repricing is still under way.
The same delay may matter for trading the threshold contracts themselves. A trader who identifies the sign of the surprise could focus on the contracts that move further into the money as the distribution adjusts. This is a hypothesis, not a tested strategy: spreads, liquidity, fees, latency, and position limits may absorb the apparent window. The current results do not establish tradable profits, lower VaR, or additional leverage capacity.
07 / Reproducibility
What can be reproduced
The code, tests, aggregate results, selected figures, and a deterministic synthetic demo are public. The demo runs the full software workflow, but its outputs are not empirical evidence.
The original Bloomberg release and consensus data are licensed and cannot be redistributed. Reproducing the empirical estimates requires an authorized Bloomberg export. Sparse trading is another limitation: a flat path can mean stable beliefs or no new quote activity.
This page reports the audited 40-event specification in the public repository. Licensed Bloomberg inputs are not redistributed.